
Exploring the Java Heap (with Ruby and Graphviz)
21 Apr, 2004
Recently, I needed to track down a rather nasty memory-leak in a Java app, and ended up rolling together a simple heap-dump explorer.
I could probably have achieved the same result with a commercial Java profiler; in fact, we had one around. But unfortunately, one of the third-party libraries we use started failing strangely when run under the profiler. I didn't particularly want to go thru the hoops of investigating upgrades or alternatives. I was also worried about the overhead of running our app (which gets fairly large) under a full-blown profiler. To cut a long story short, I decided to leverage hprof, the mini-profiler bundled with Sun's JDK.
hprof can be made to dump the state of the heap, using the following incantation:
$ java -Xrunhprof:heap=dump,doe=n my.MainClass
Hit CTRL-Break (or CTRL- under *nix), and you'll get a file called "java.hprof.txt", containing, among other things, a heap dump:
HEAP DUMP BEGIN (226541 objects, 12621472 bytes) ...
ROOT 22538ac8 (kind=<thread>, id=29, trace=39041)
ROOT 224de7e0 (kind=<thread>, id=19, trace=39041)
...
ARR 213470f8 (sz=24, trace=11796, nelems=2,
              elem type=java.lang.Object@a19378)
        [0]             2063d760
        [1]             21349ce0
OBJ 213471c0 (sz=48, trace=11797,
              class=org.openide.util.WeakSet$Entry@2020e660)
        this$0          21313990
        iterChainPrev   21f1a068
        queue           21313a30
        referent        205520d8
OBJ 2134c880 (sz=24, trace=11799,
              class=java.lang.ref.WeakReference@ab22c0)
        next            2134c880
        queue           a19900
...
As you can see, it contains info about each object (or array, or class), including size, and references to other objects. If you have time on your hands, you can search around this with a text editor, and get some idea of what's going on. With that many objects to deal with, I wrote a Ruby script (hprofexplore.rb) to help me out.
Usage is fairly simple; first, you point the script at the hprof output, from which it extracts the heap data.
$ hprofexplore.rb java.hprof.txt
loading HPROF data from java.hprof.txt ...
219191 objects loaded
Then you get a command prompt:
>> ?
S <pattern> ... list objects with type matching (glob-style) <pattern>
<id>        ... goto object with specified <id>
O           ... display output references FROM current object
I           ... display input references TO current object
D [<file>]  ... dump a DOT graph of visited objects to <file>
                (default: last DOT output file)
U           ... un-visit the current object, for graphing purposes
C           ... clear the visited-set; ie. un-visit all objects
Q           ... quit
The "s" (search) command is a good place to start if you have a clue as to what type of object is not getting garbage-collected:
>> s model.Belief
21f5e2a8    OBJECT foo.model.Belief size=40
21f5d7c8    OBJECT foo.model.BeliefMode size=16
21f5d7e8    OBJECT foo.model.BeliefMode size=16
21f5cfa8    CLASS foo.model.Belief
21f5d808    OBJECT foo.model.BeliefMode size=16
21f5d828    OBJECT foo.model.Belief size=40
21f5dd88    OBJECT foo.model.Belief size=40
21f5d788    CLASS foo.model.BeliefMode
8 objects matched
With this starting point, you can focus on a particular object, and get info about the references to/from it:
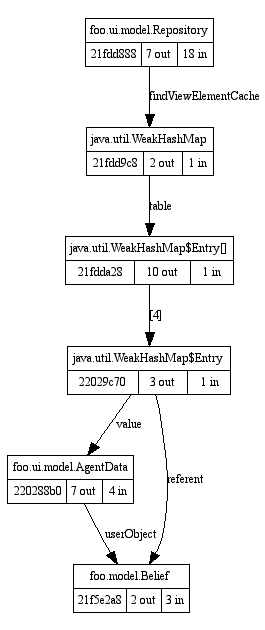
>> 21f5e2a8 i
21f5e2a8    OBJECT foo.model.Belief size=40
  <- [0]               21fa8408  (ARRAY java.lang.Object)
  <- userObject        220288b0  (OBJECT foo.ui.model.AgentData)
  <- referent          22029c70  (OBJECT java.util.WeakHashMap$Entry)
Explore the reference-graph by typing in object-IDs (cut and paste comes in handy here). Appending "i" or "o" to an object-ID causes input or output references to be printed as well:
>> 220288b0 i
220288b0    OBJECT foo.ui.model.AgentData size=48
  <- [0]               220270c8  (ARRAY java.lang.Object)
  <- source            22028990  (OBJECT java.beans.PropertyChangeSupport)
  <- value             22029c70  (OBJECT java.util.WeakHashMap$Entry)
  <- repositoryElement 22688778  (OBJECT foo.ui.nodes.BeliefNode)

>> 22029c70 i
22029c70    OBJECT java.util.WeakHashMap$Entry size=40
  <- [4]               21fdda28  (ARRAY java.util.WeakHashMap$Entry)

>> 21fdda28 i
21fdda28    ARRAY java.util.WeakHashMap$Entry size=80 n_elements=16
  <- table             21fdd9c8  (OBJECT java.util.WeakHashMap)

>> 21fdd9c8 i
21fdd9c8    OBJECT java.util.WeakHashMap size=48
  <- findViewElementCache 21fdd888  (OBJECT foo.ui.model.Repository)

>> 21fdd888
21fdd888    OBJECT foo.ui.model.Repository size=48
Now the cool part: the "d" command allows you to write a reference-graph of the visited objects, in "DOT" format:
d graph.dot
wrote graph.dot
(see graph.dot)
You can then use the "dot" tool from AT&T's GraphViz project, to render it as PNG (or GIF, or JPG):
$ dot -Tpng -o graph.png graph.dot
A useful toy, in any case.


Feedback